A score that means something.
No raw Kp index to decode. A single number adjusted to your latitude, and a plain call on what to do tonight.
- Location-adjusted, not a generic national number
- Visibility tiers for eye, phone, and camera
- One-line advice: go now, worth a look, or stay in
- Advanced View for the full data underneath
Know before it peaks.
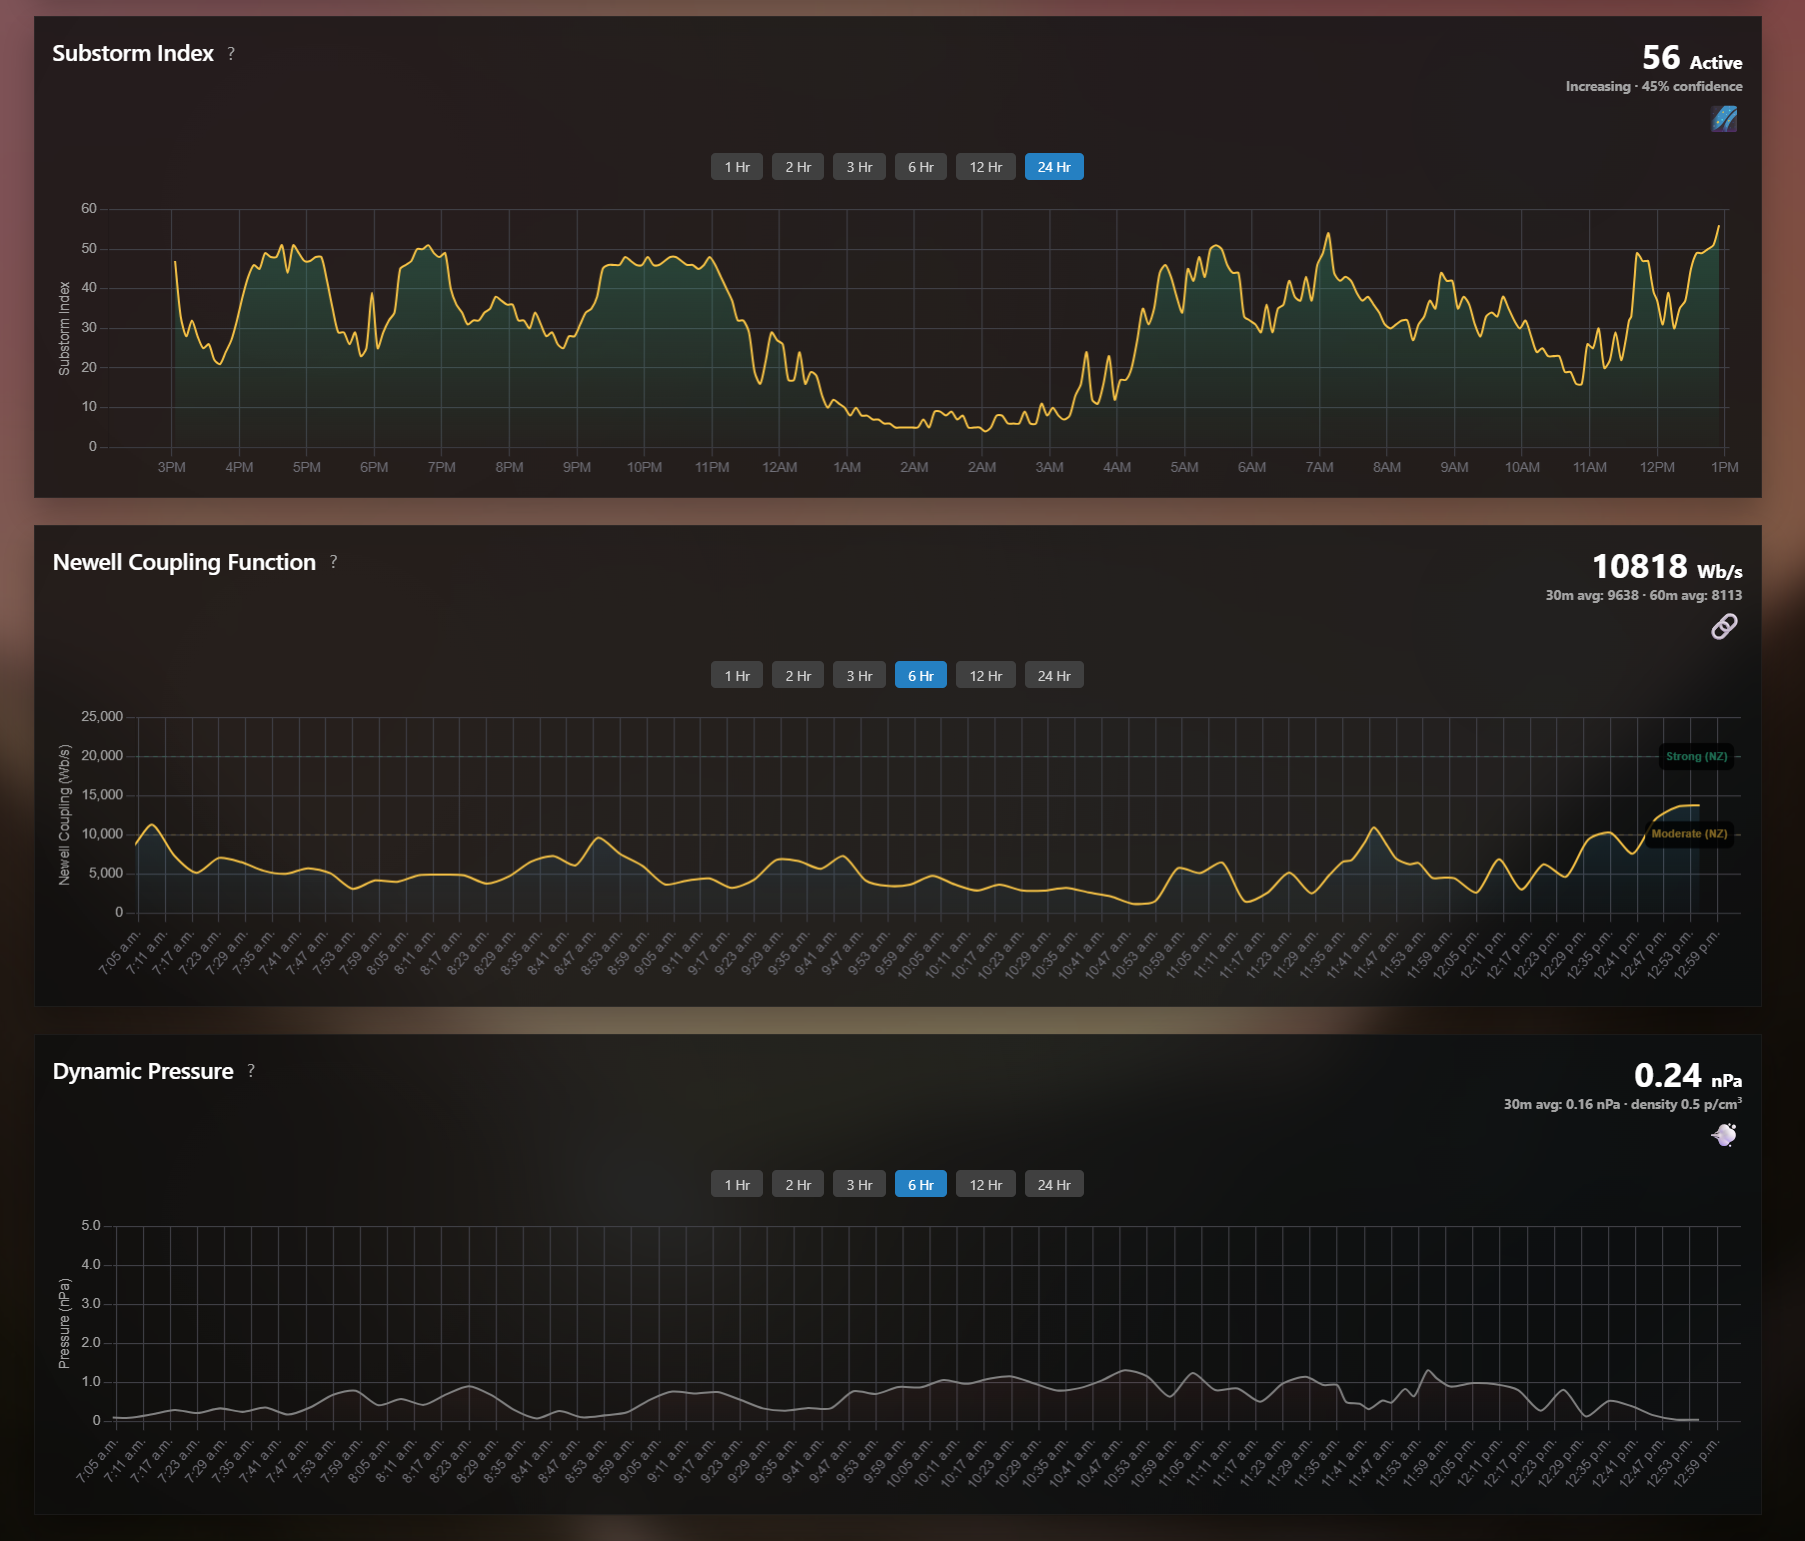
A physics-based model reads the magnetic field in real time and estimates the odds of a substorm, and roughly when it will arrive.
- Real-time likelihood percentage
- Predicted time window, like 0 to 30 minutes
- A clear next step when it fires
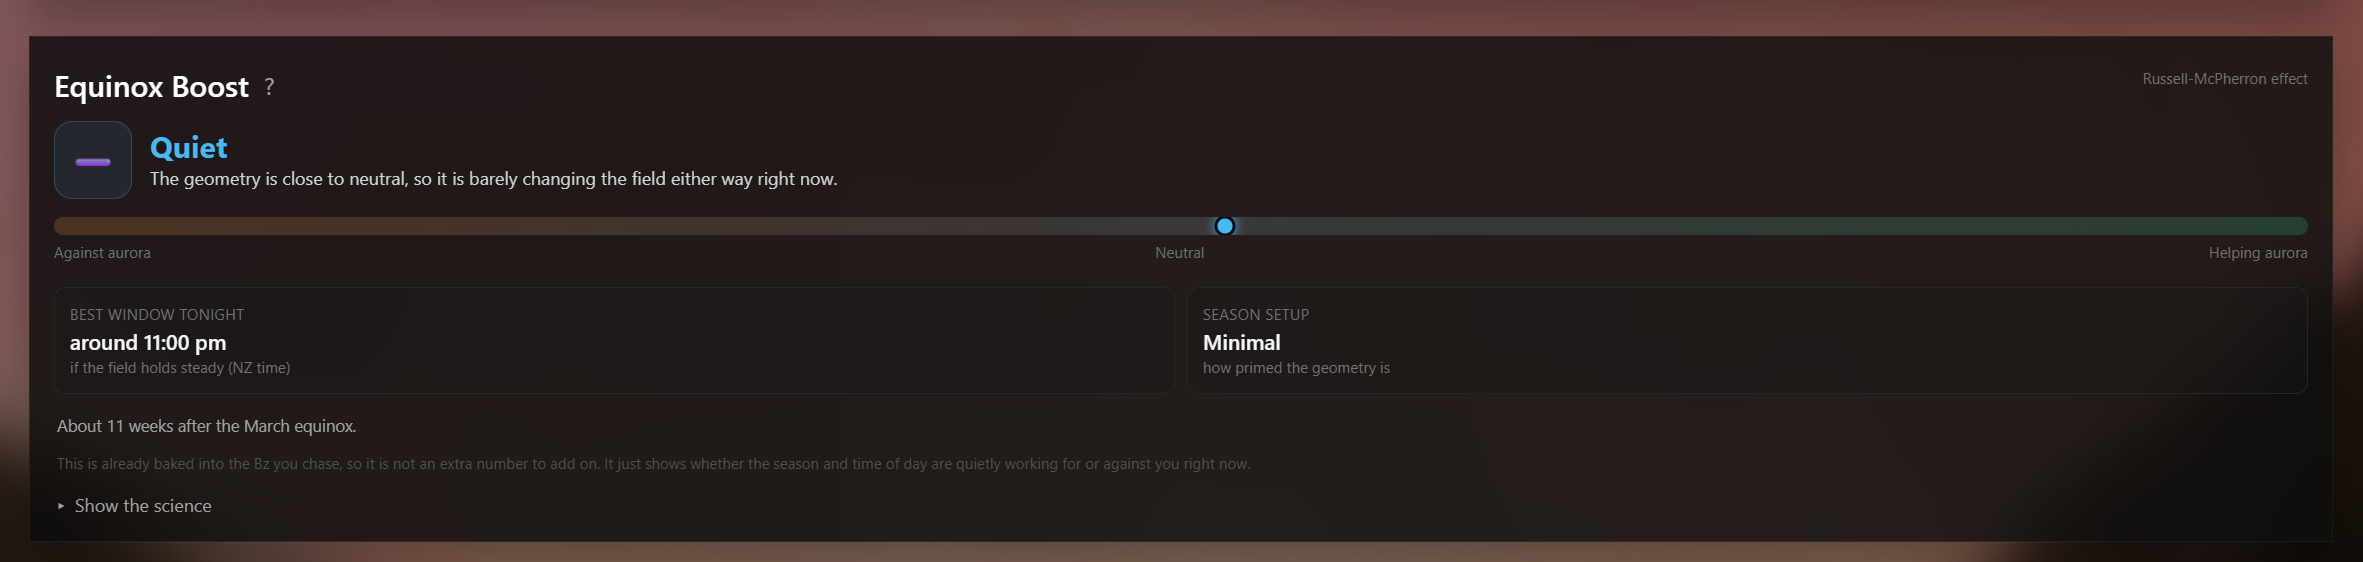
- Seasonal context, including the equinox boost
The Sun, tracked all week.
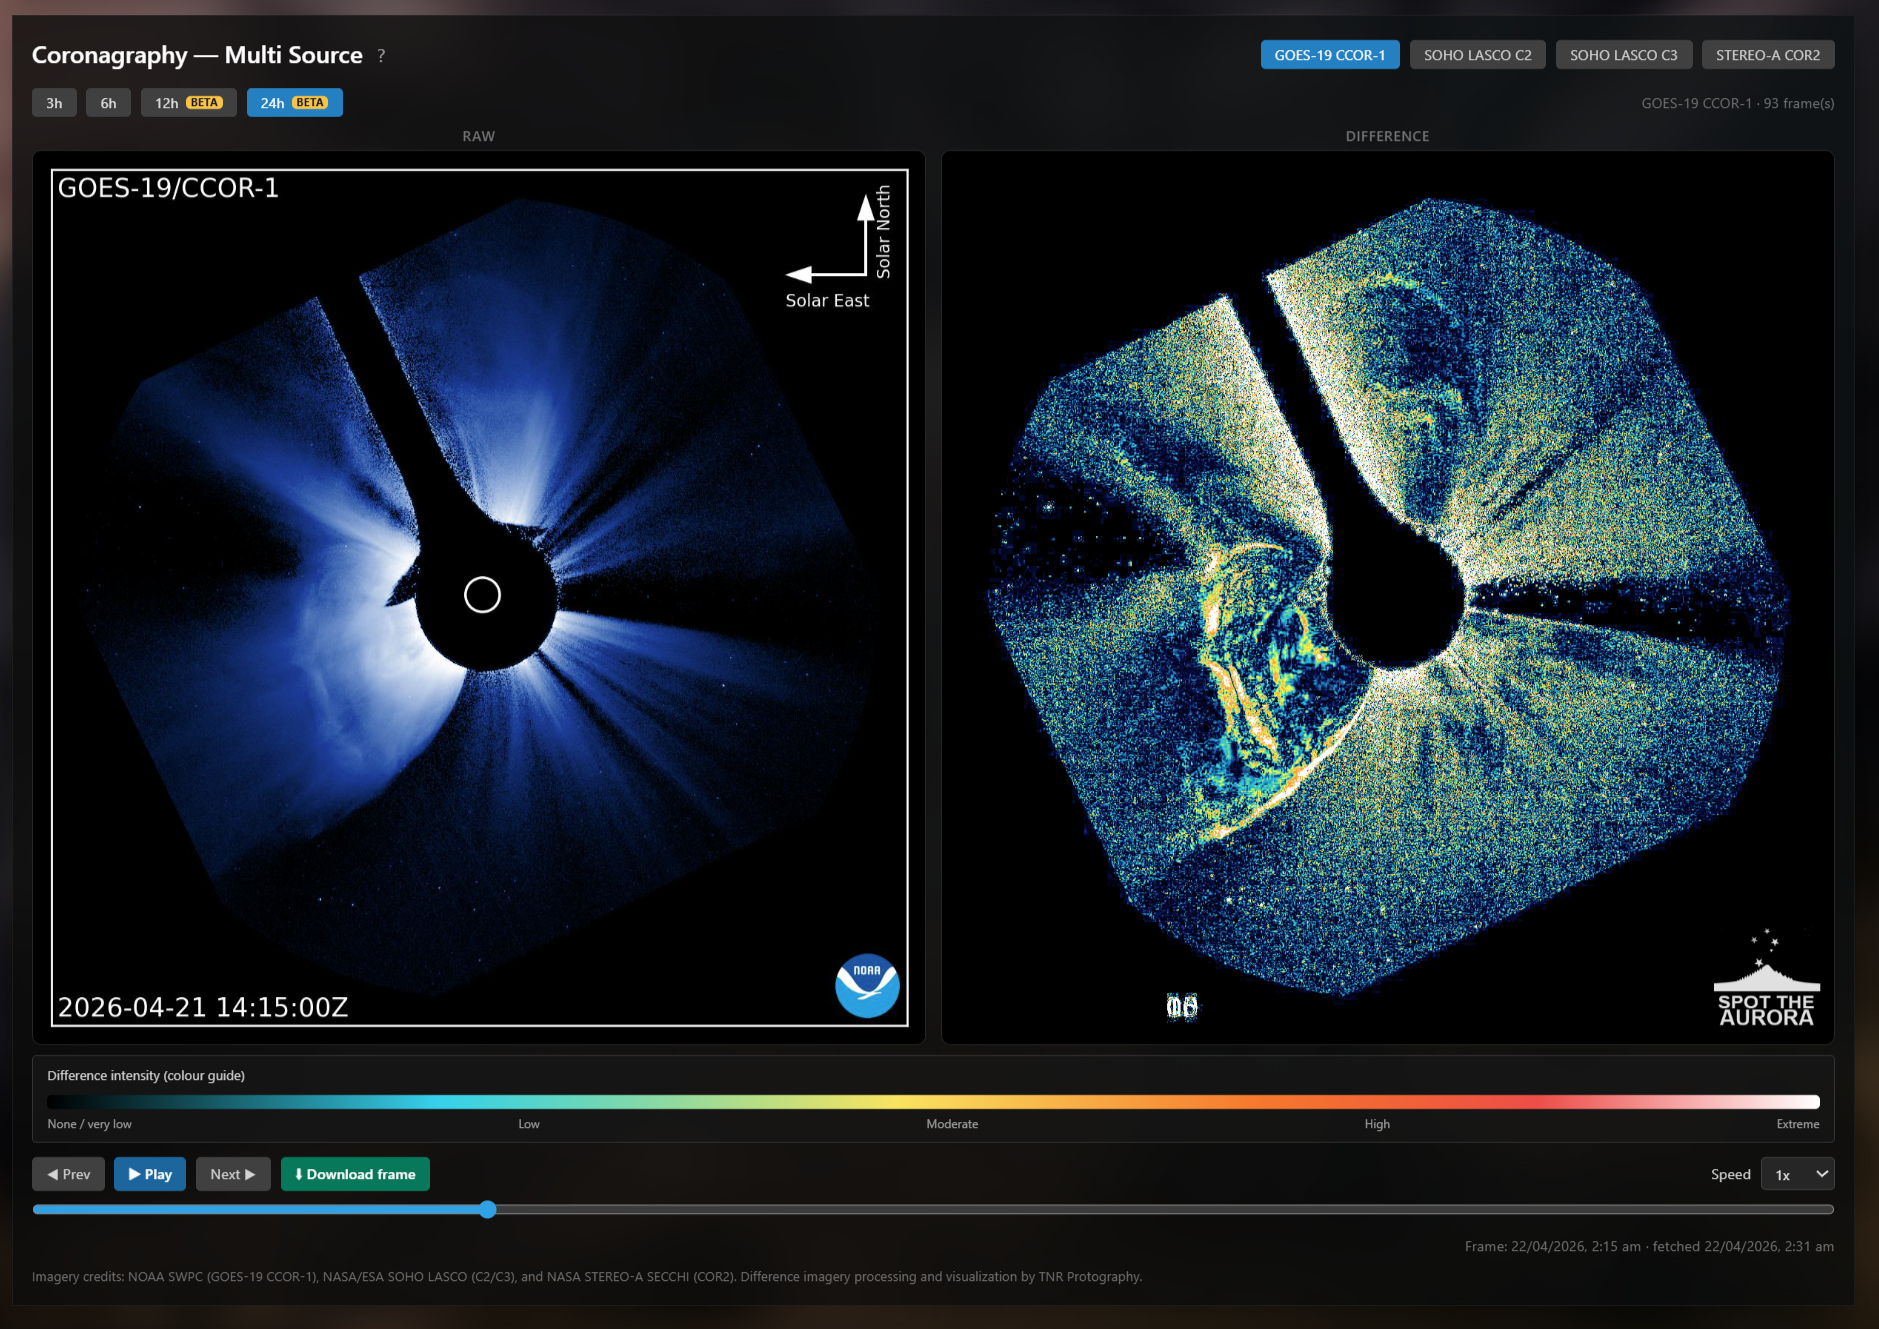
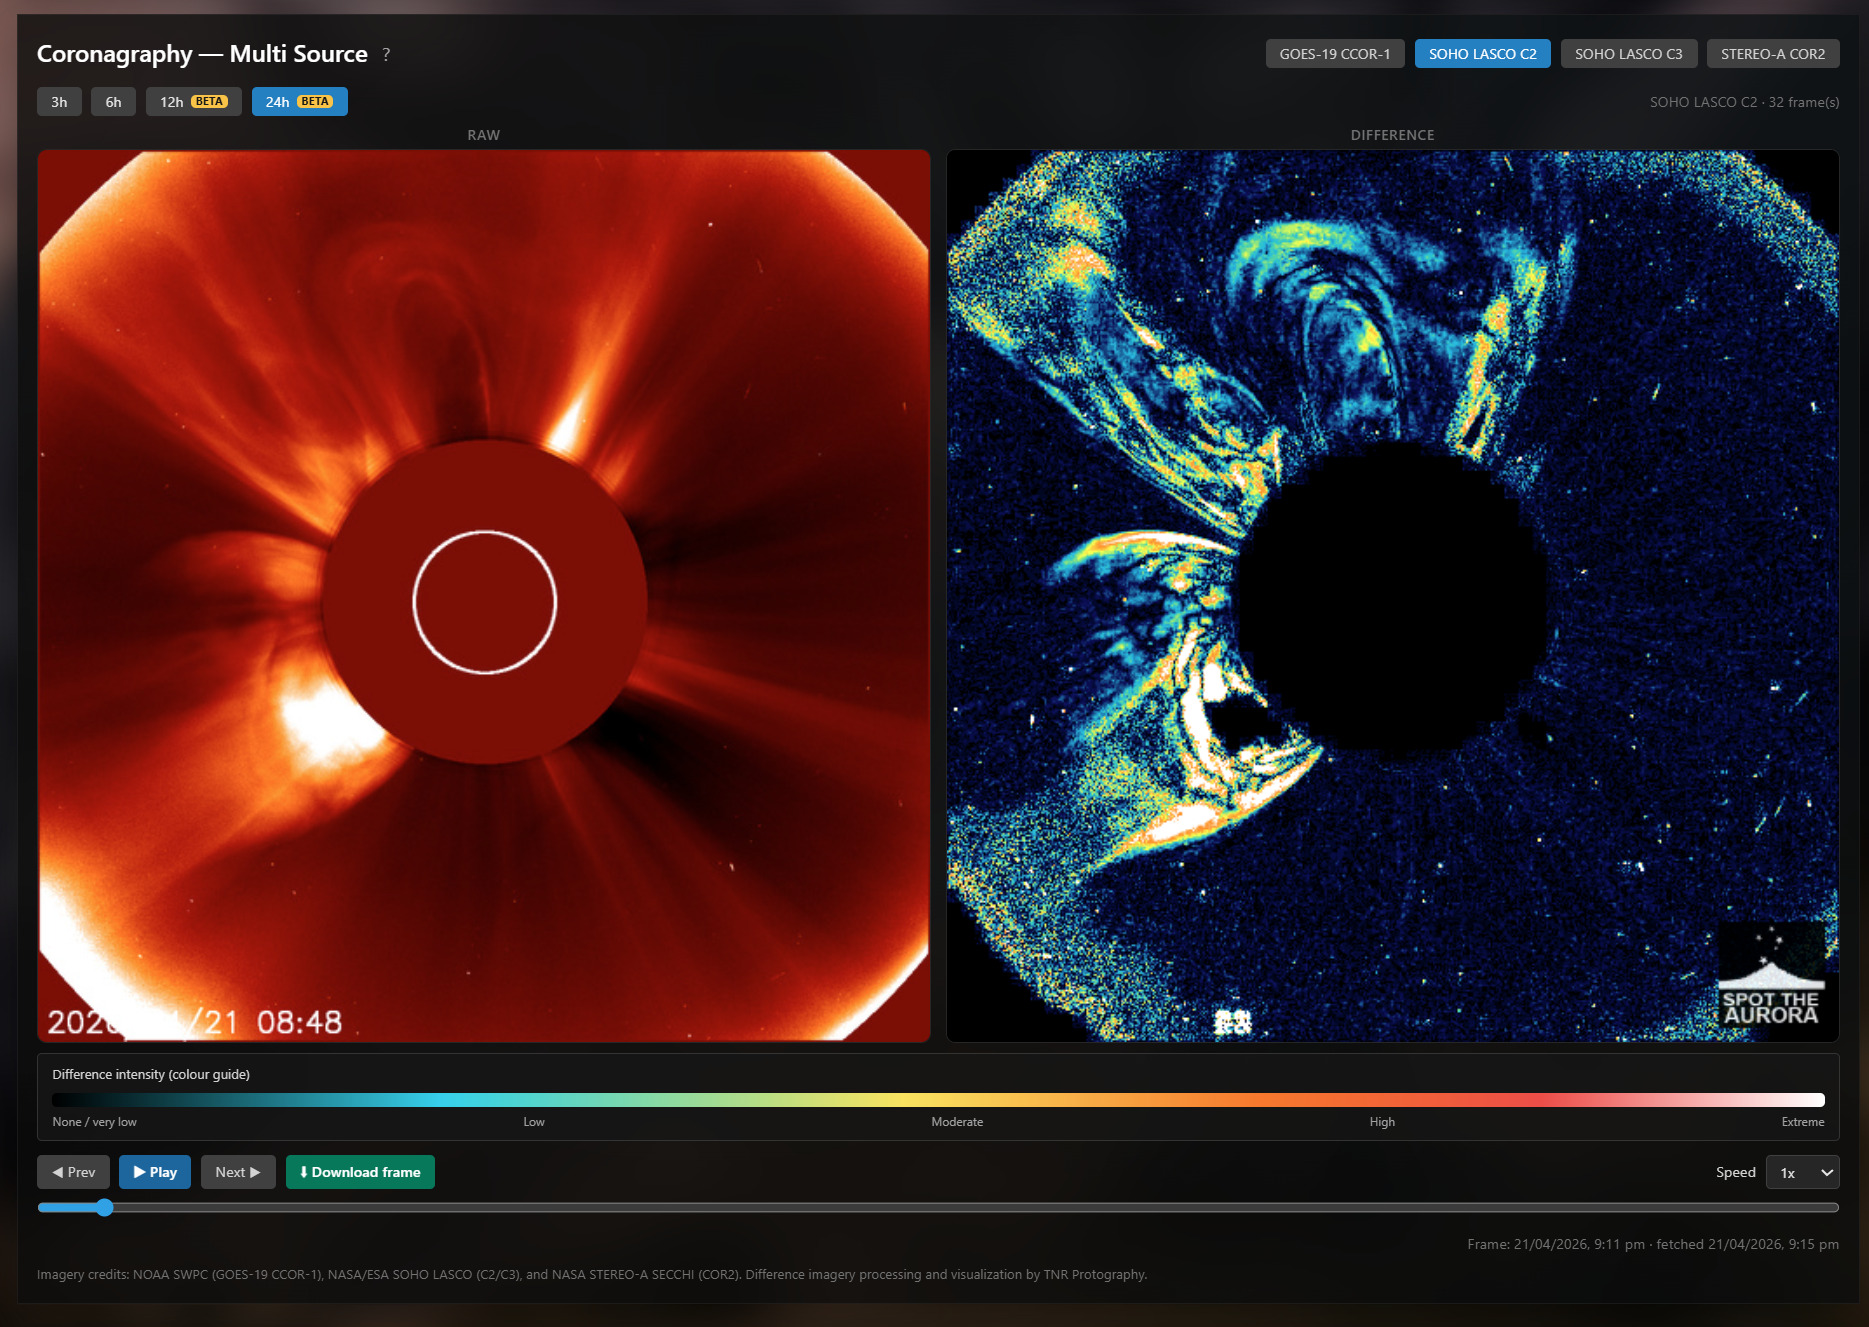
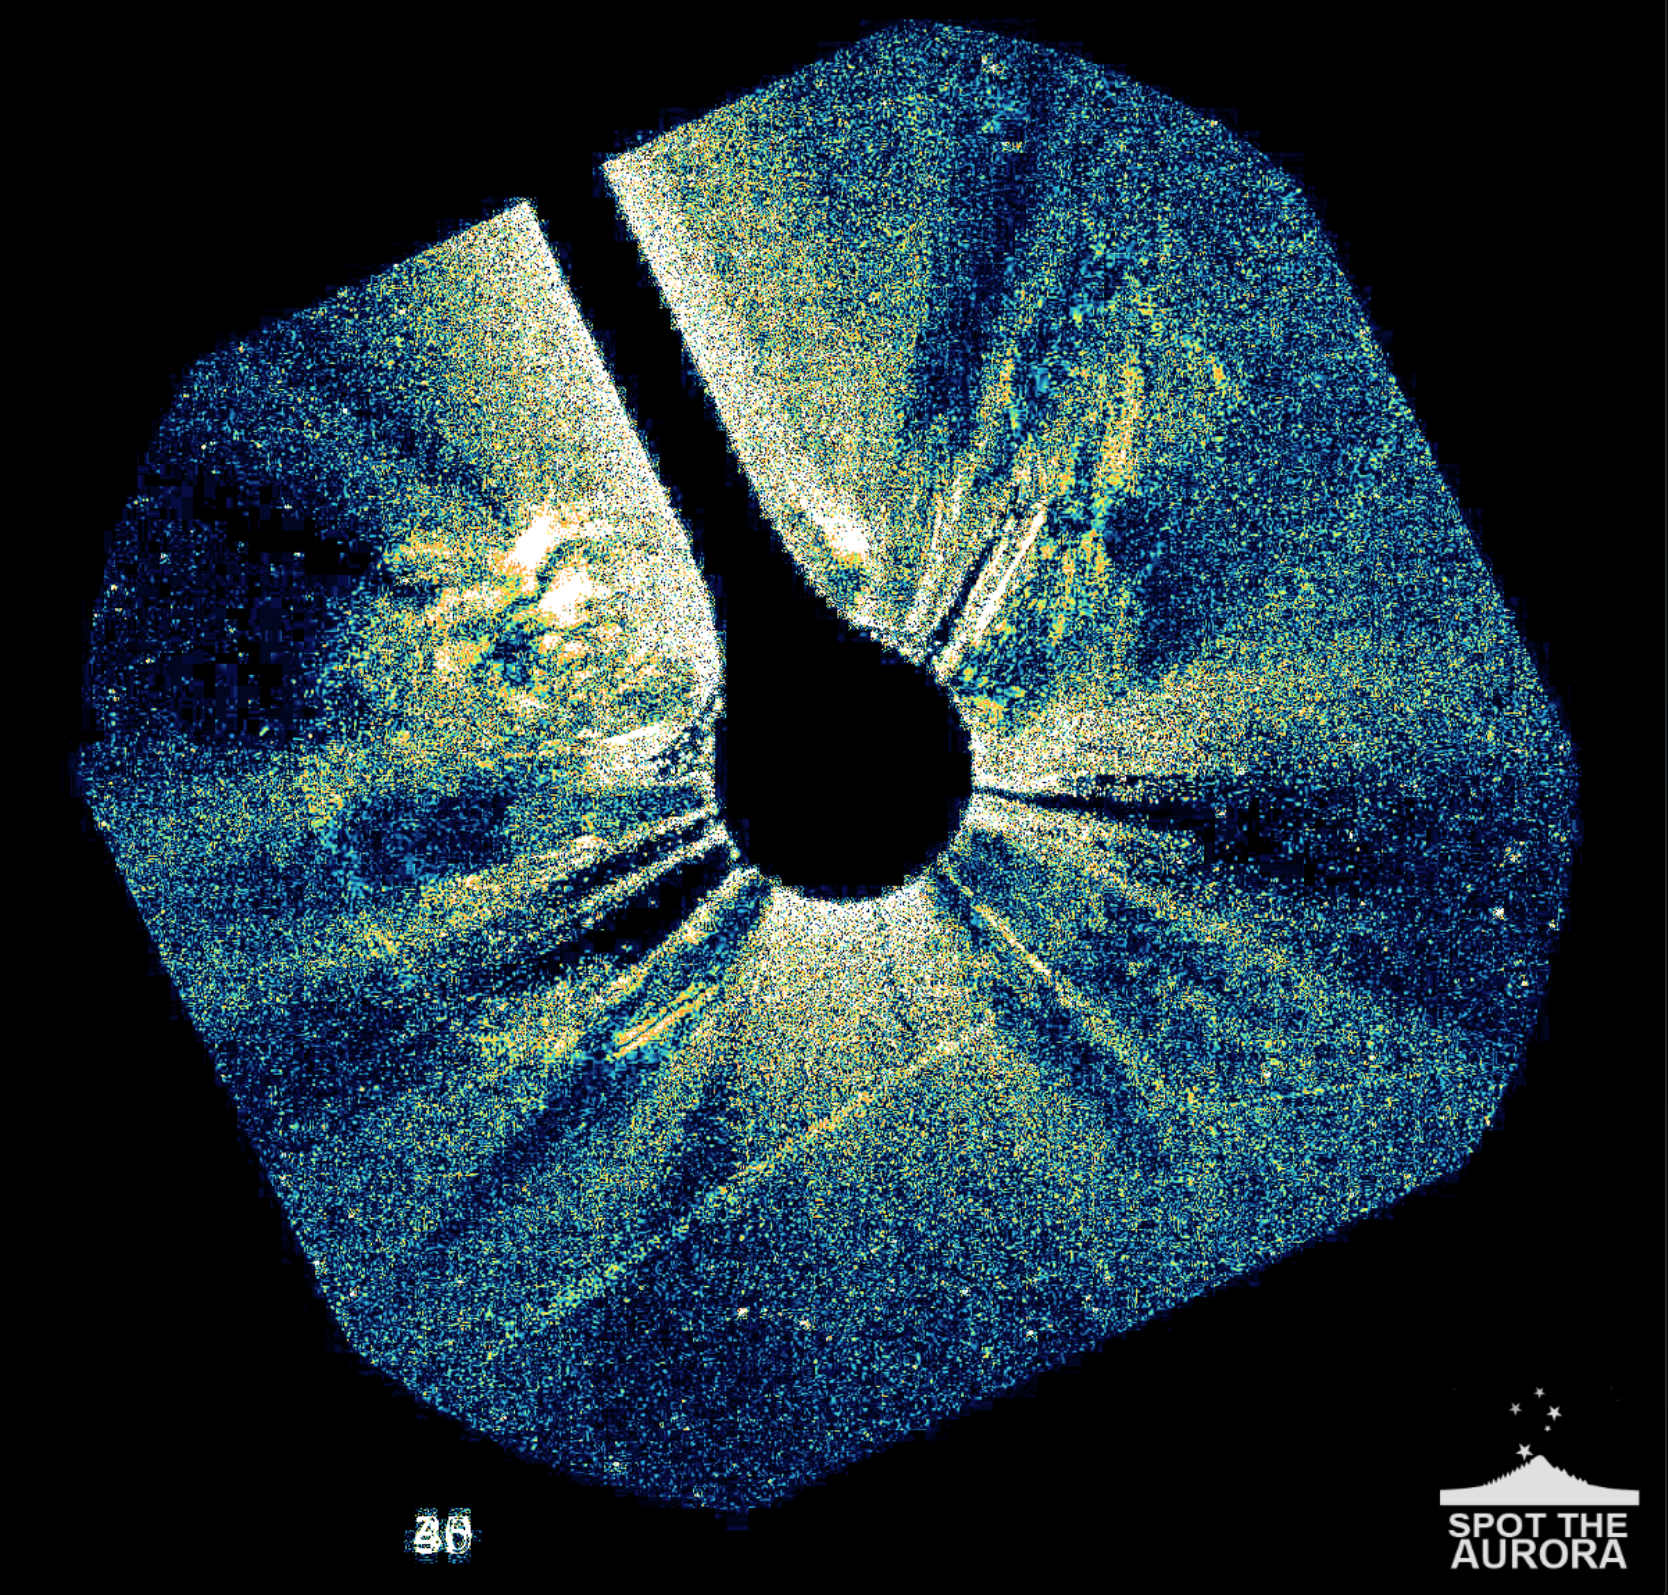
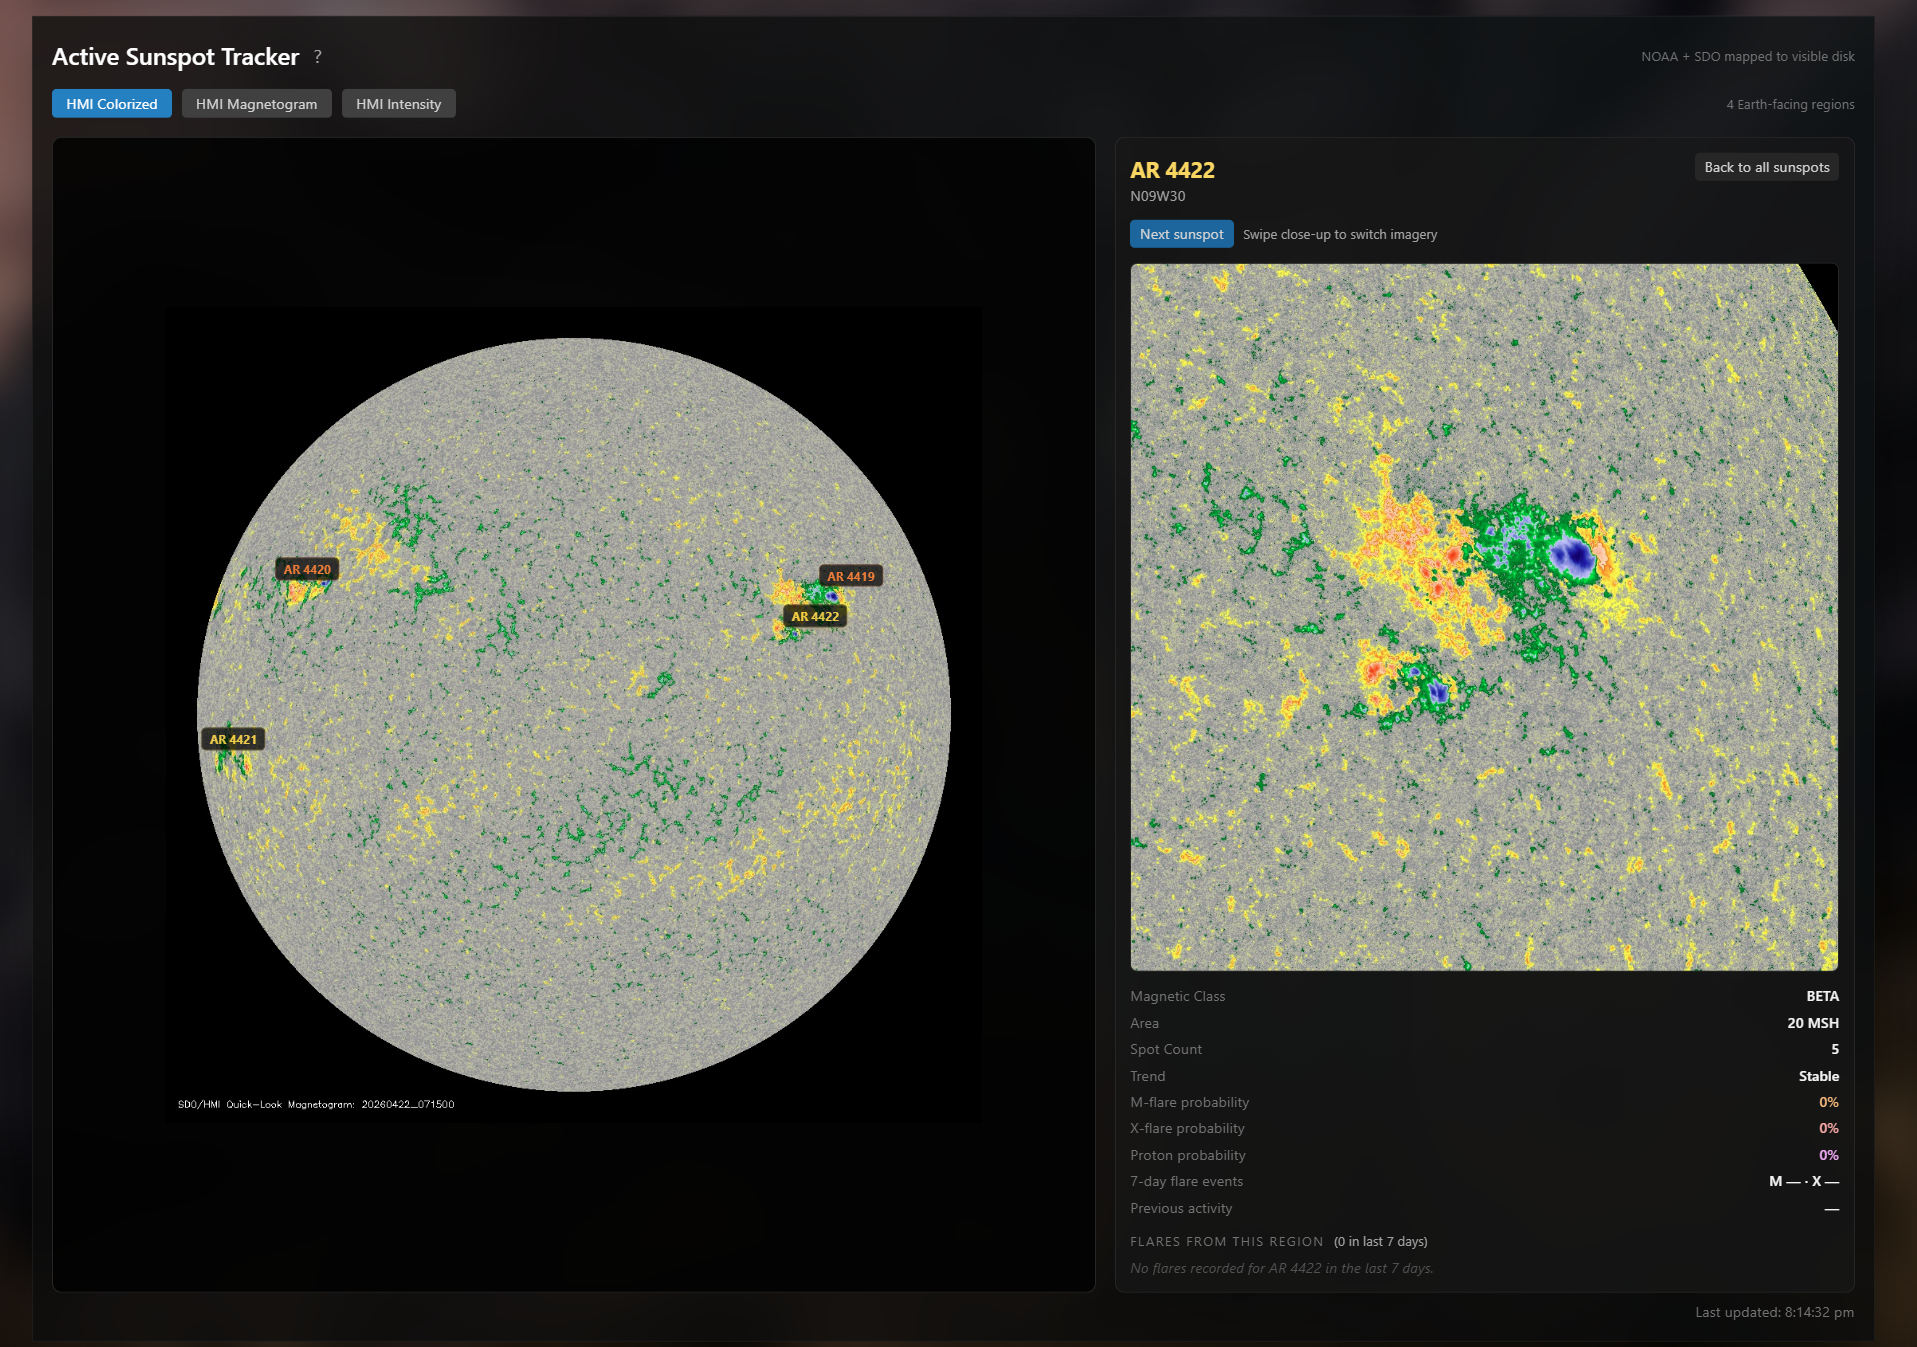
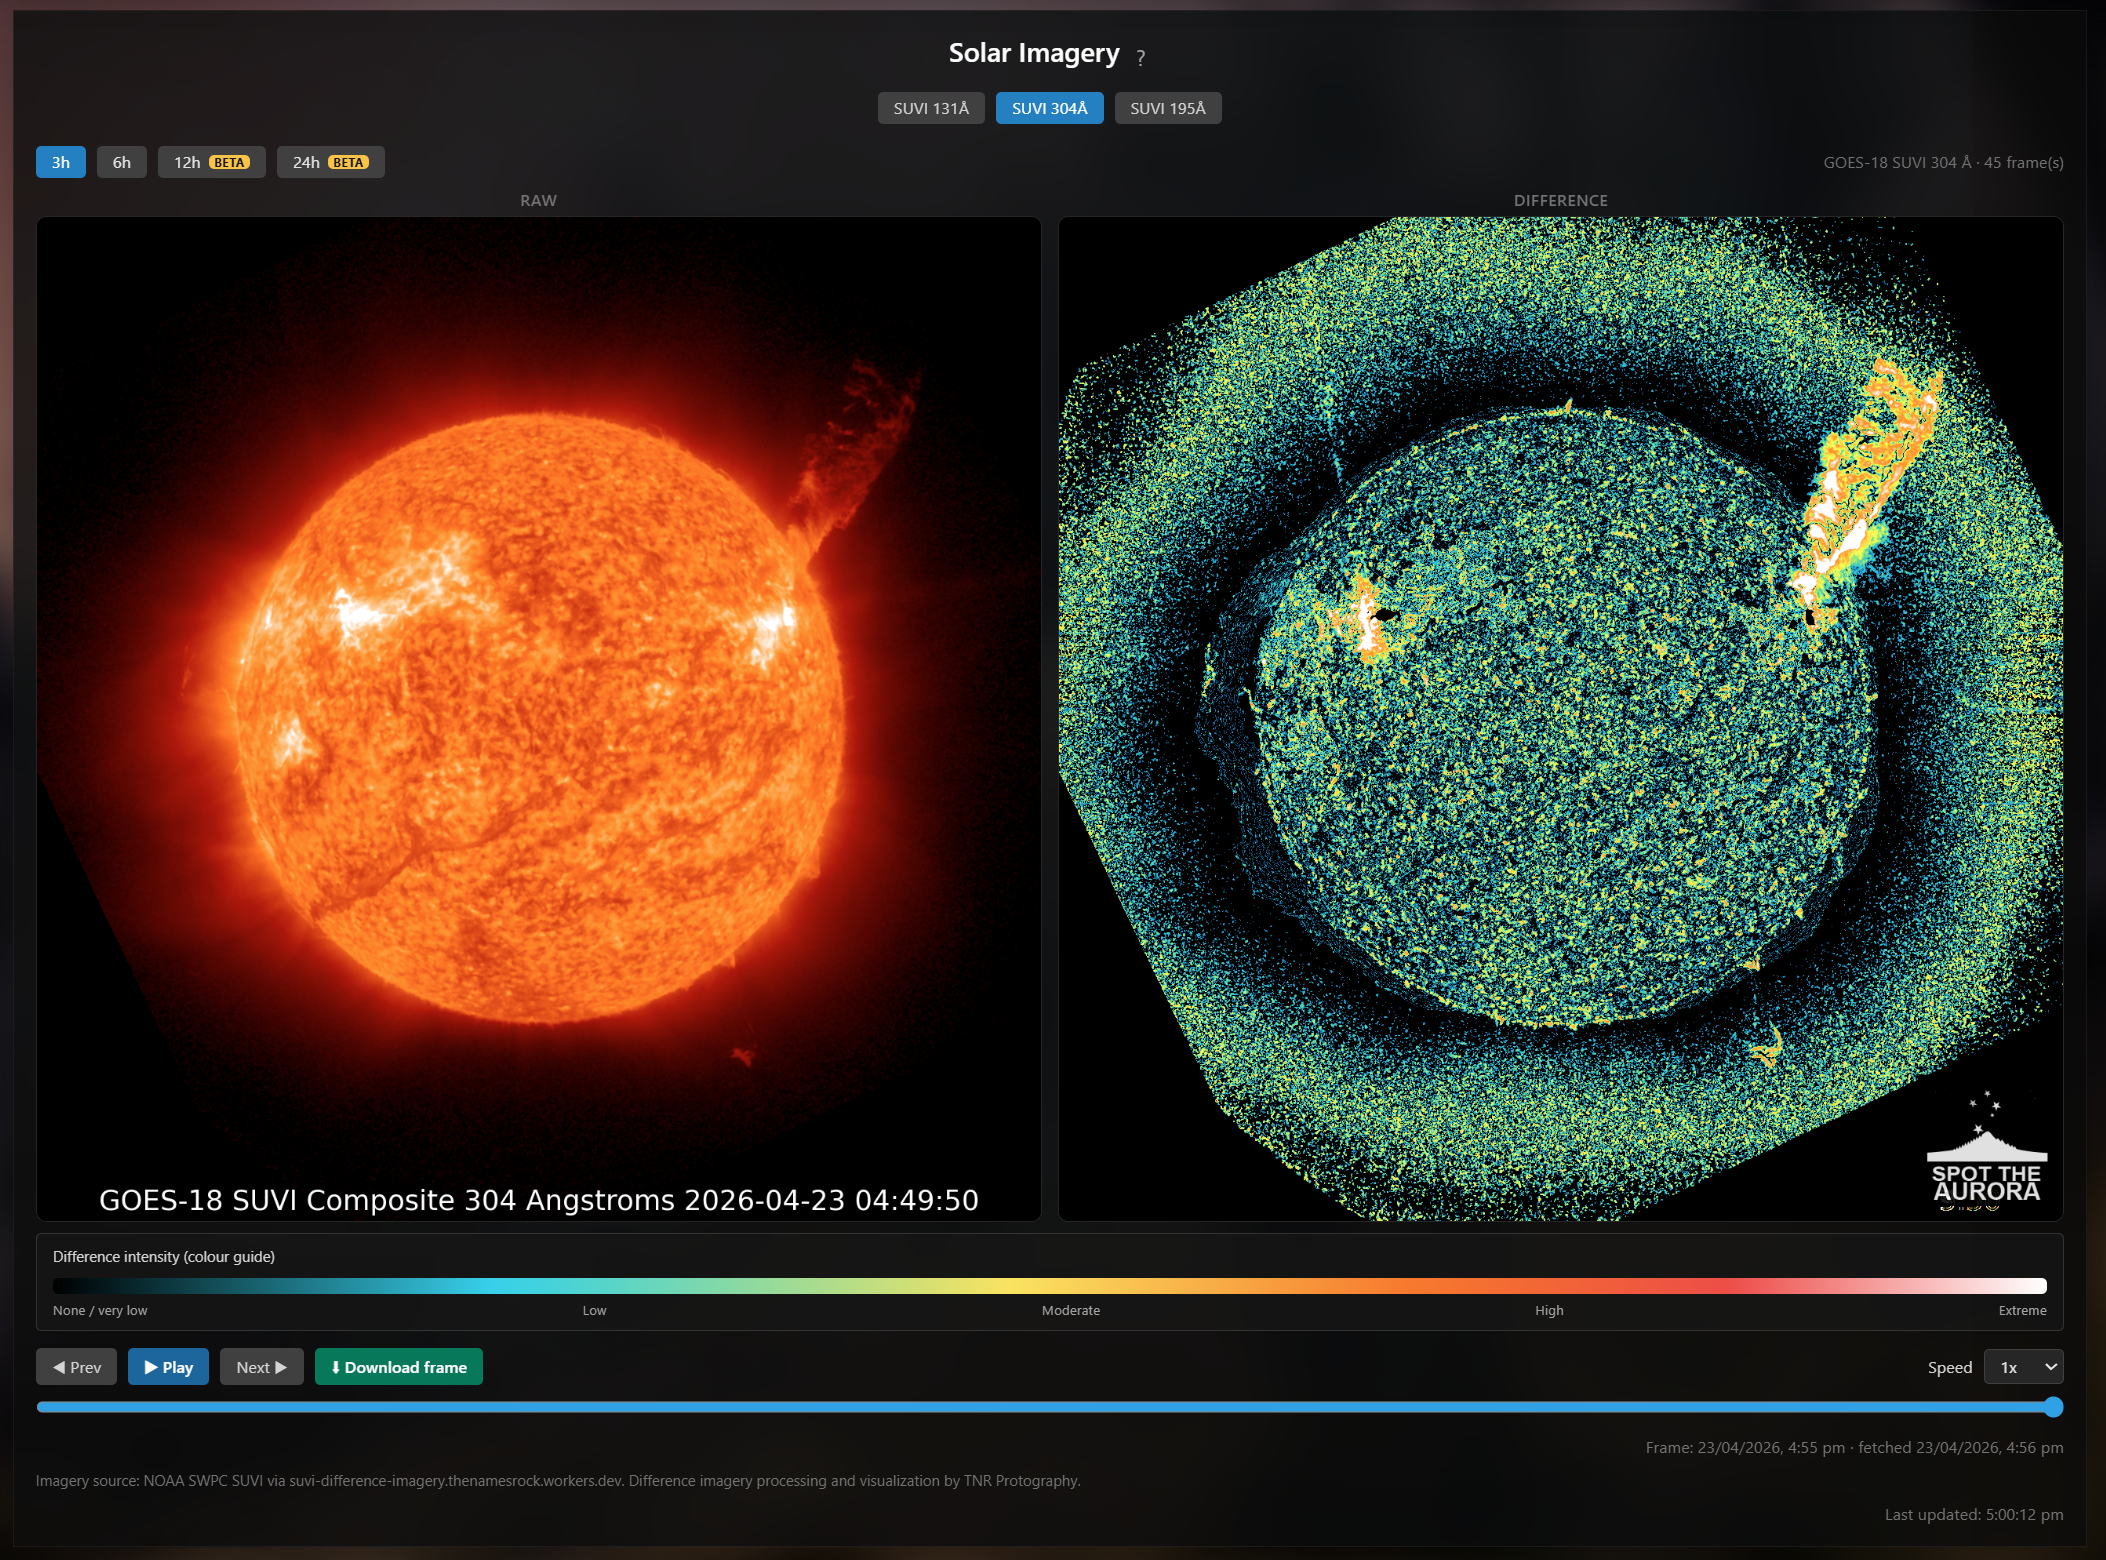
Seven days of X-ray and proton flux history, interplanetary shock detection, sunspot tracking, and custom difference imagery built to reveal detail the raw feeds hide.
- 7-day X-ray and proton flux history
- Kyoto Dst index for long storms
- Shock detection with post-arrival solar wind conditions
- Instant alerts for M5 and X-class flares
Watch it cross 150 million kilometres.
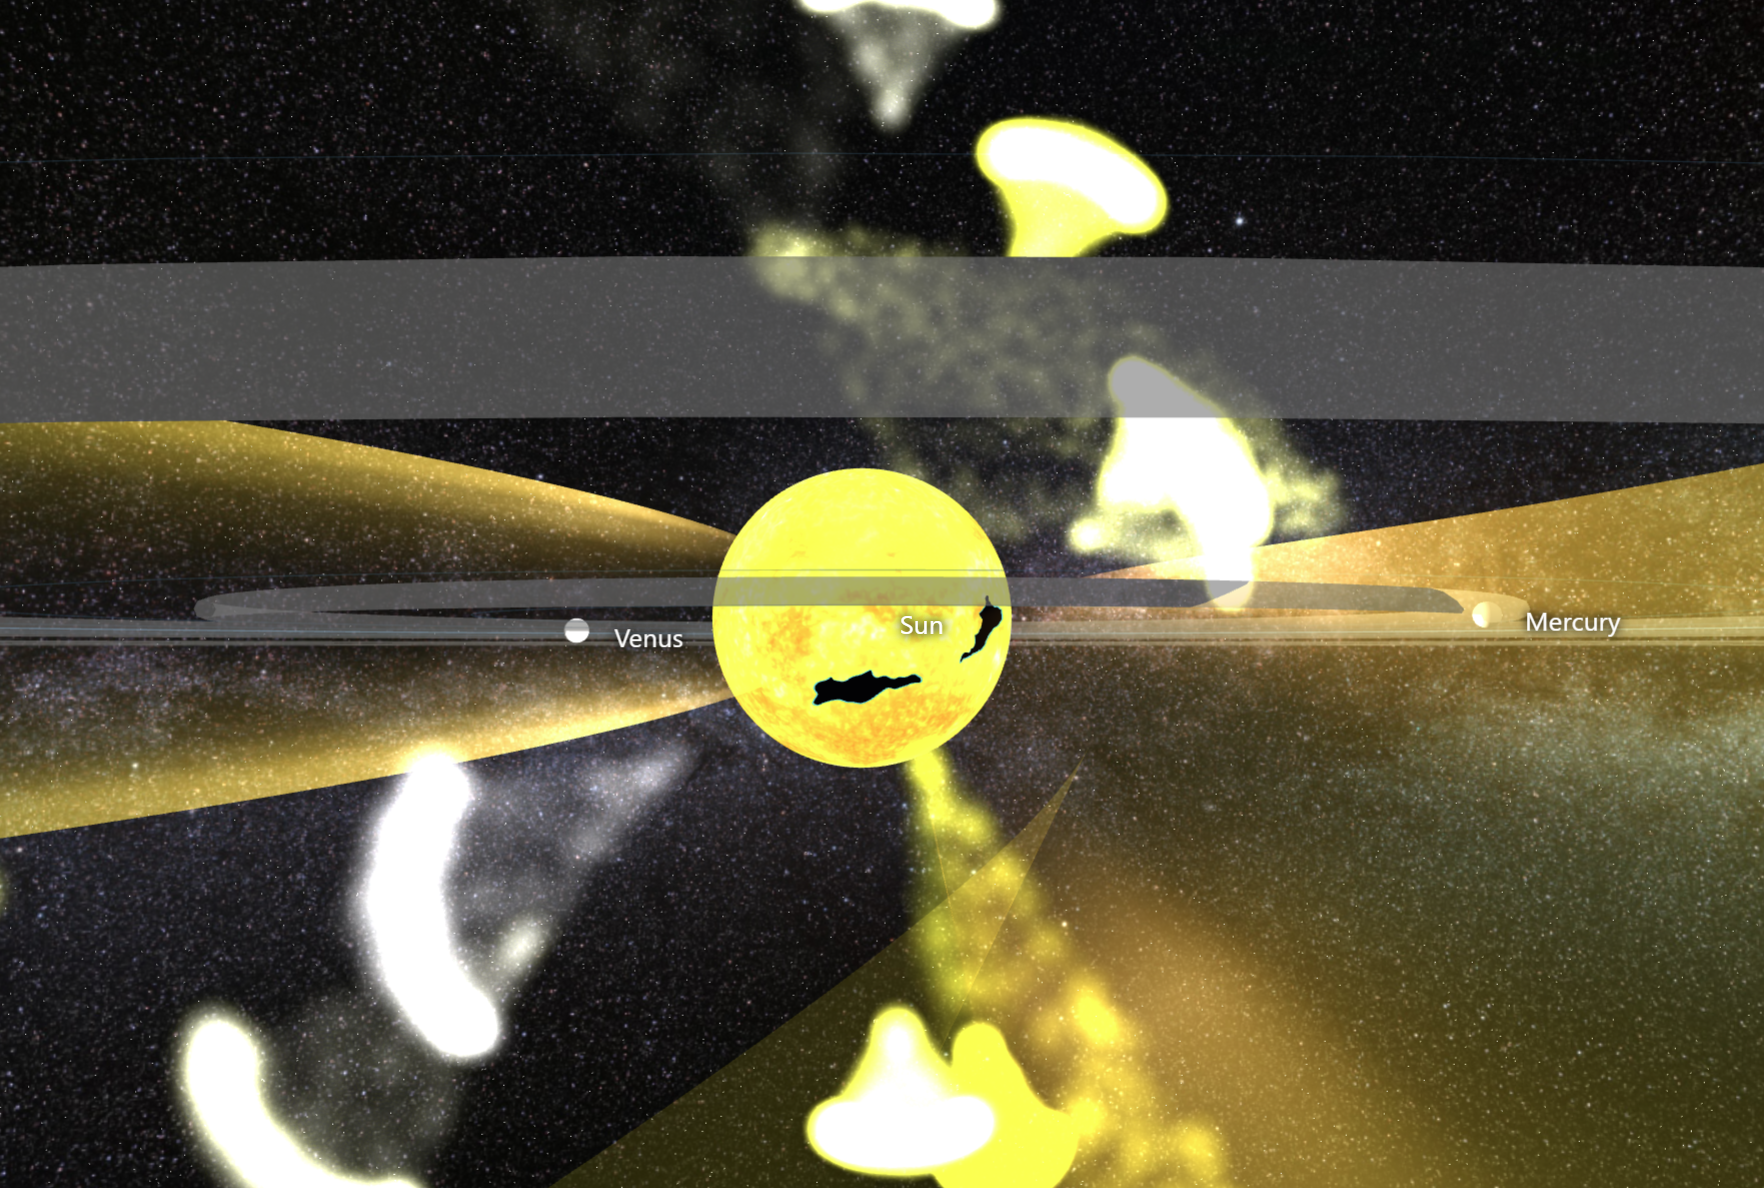
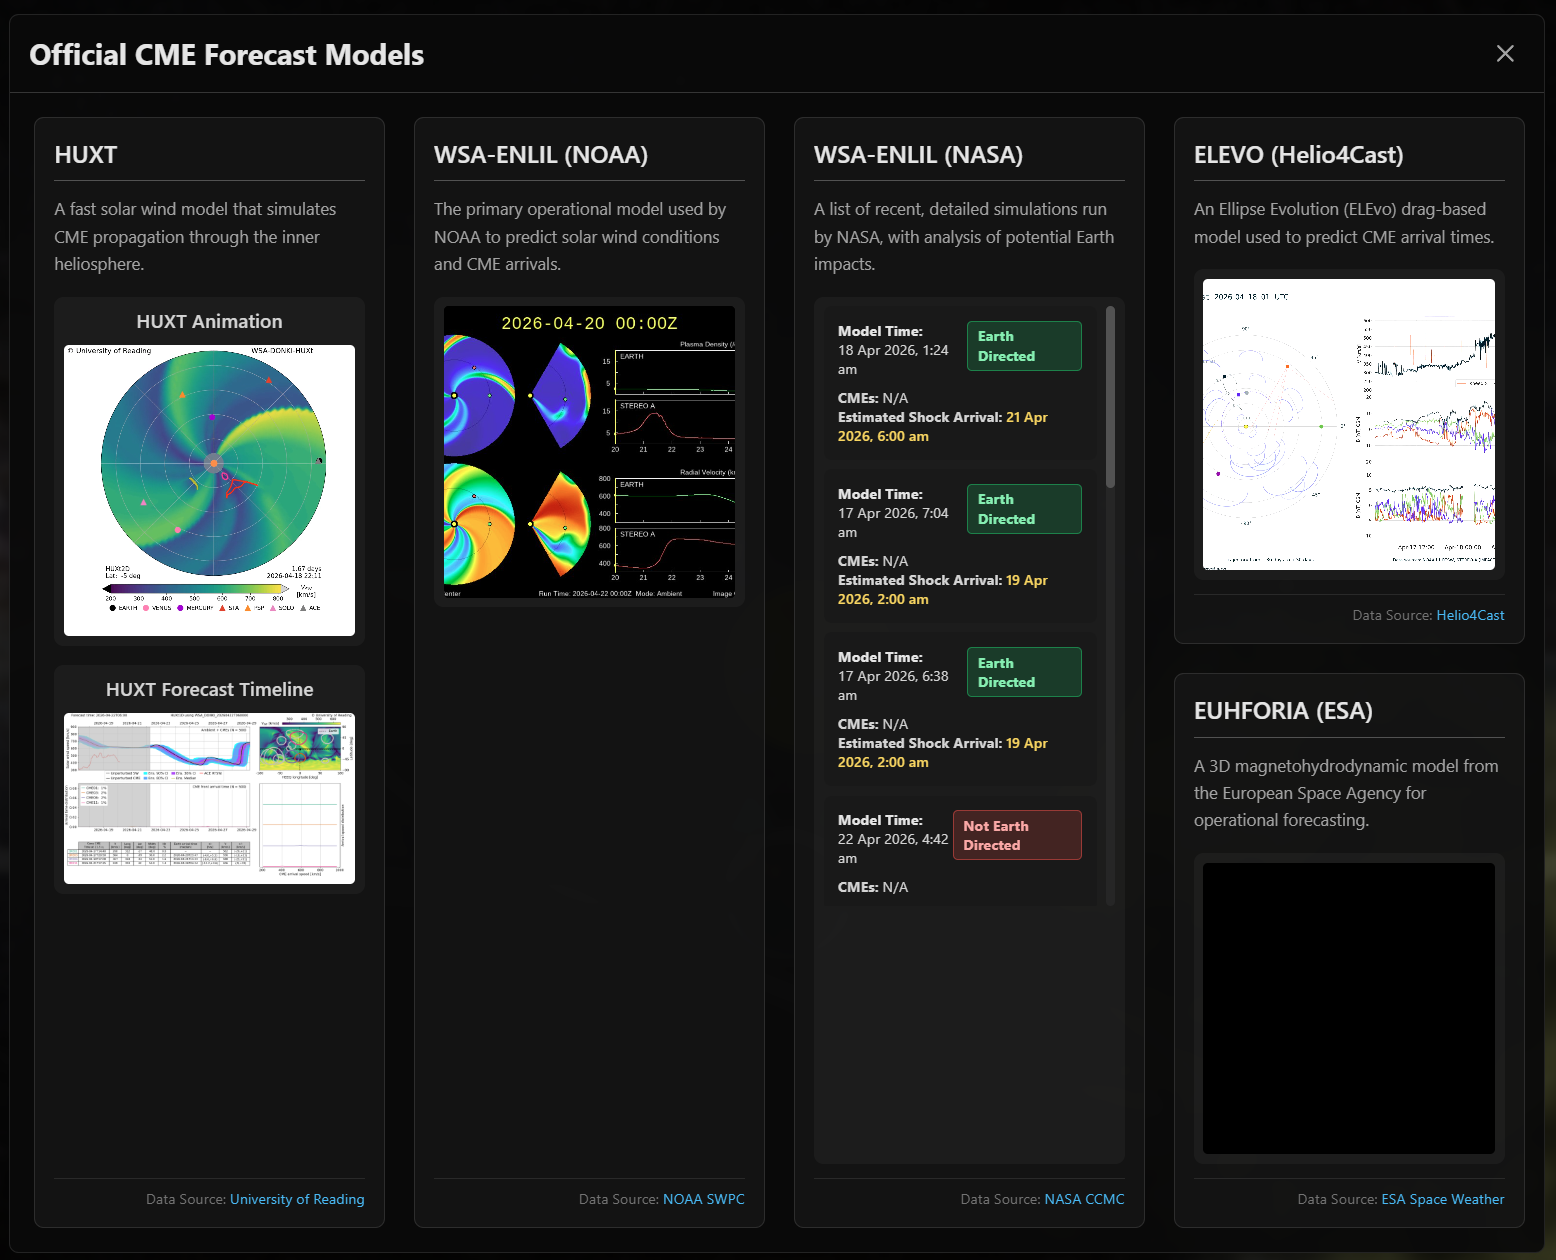
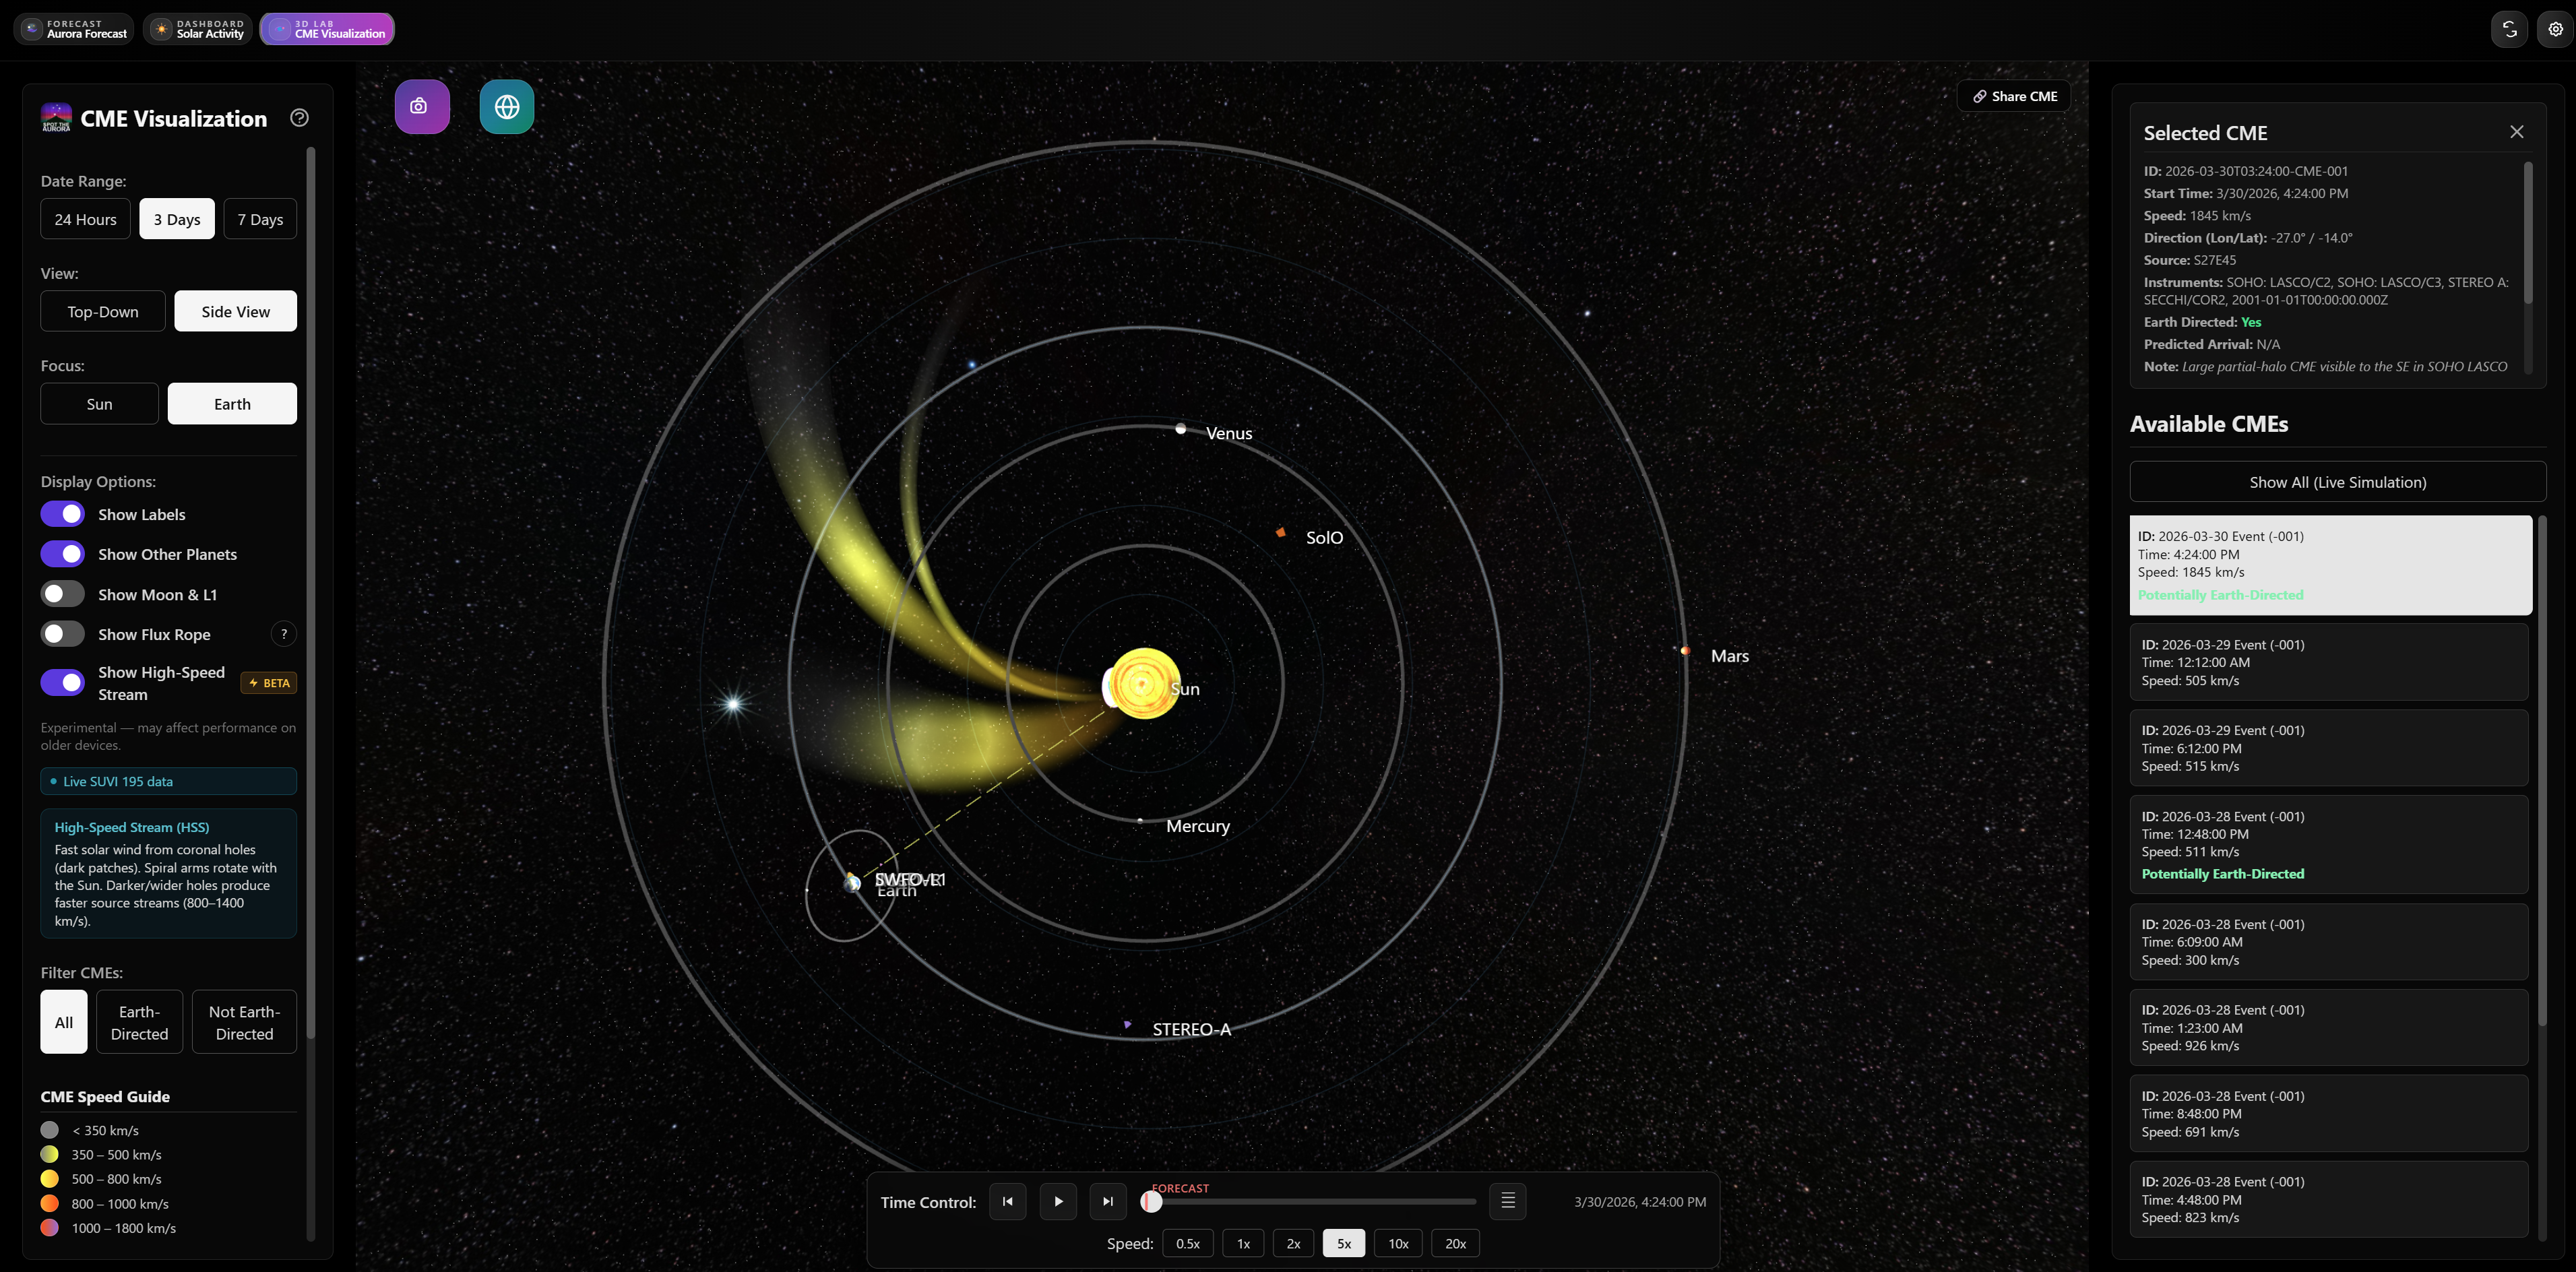
A world-first live 3D model shows coronal mass ejections and high-speed streams in transit, with official agency forecasts alongside for comparison.
- Interactive 3D view, scrub through time
- Model individual CMEs from the event panel
- Coronal hole and HSS visualisation, also a world first
- Compare against WSA-ENLIL and HUXT models
What the country is seeing, live.
A community map of aurora sightings across New Zealand, including honest reports of clear skies and nothing visible, which matter just as much.
- Reports from naked eye, phone, and DSLR
- Negative reports help calibrate true visibility
- Over 1,000 mapped locations nationwide
Quiet until it matters.
Configure exactly which alerts reach your phone, by score threshold, by flare class, or by daily digest.
- Your own aurora score threshold
- Alerts for specific flare classes
- Daily digest by visibility level
- Built-in self-test if notifications ever go quiet